
Voters 5
-
-
M
-
P
-
R
-
R

Load curve per site
- Backlog
- Subscribe
|
R |
Robin Riedel |
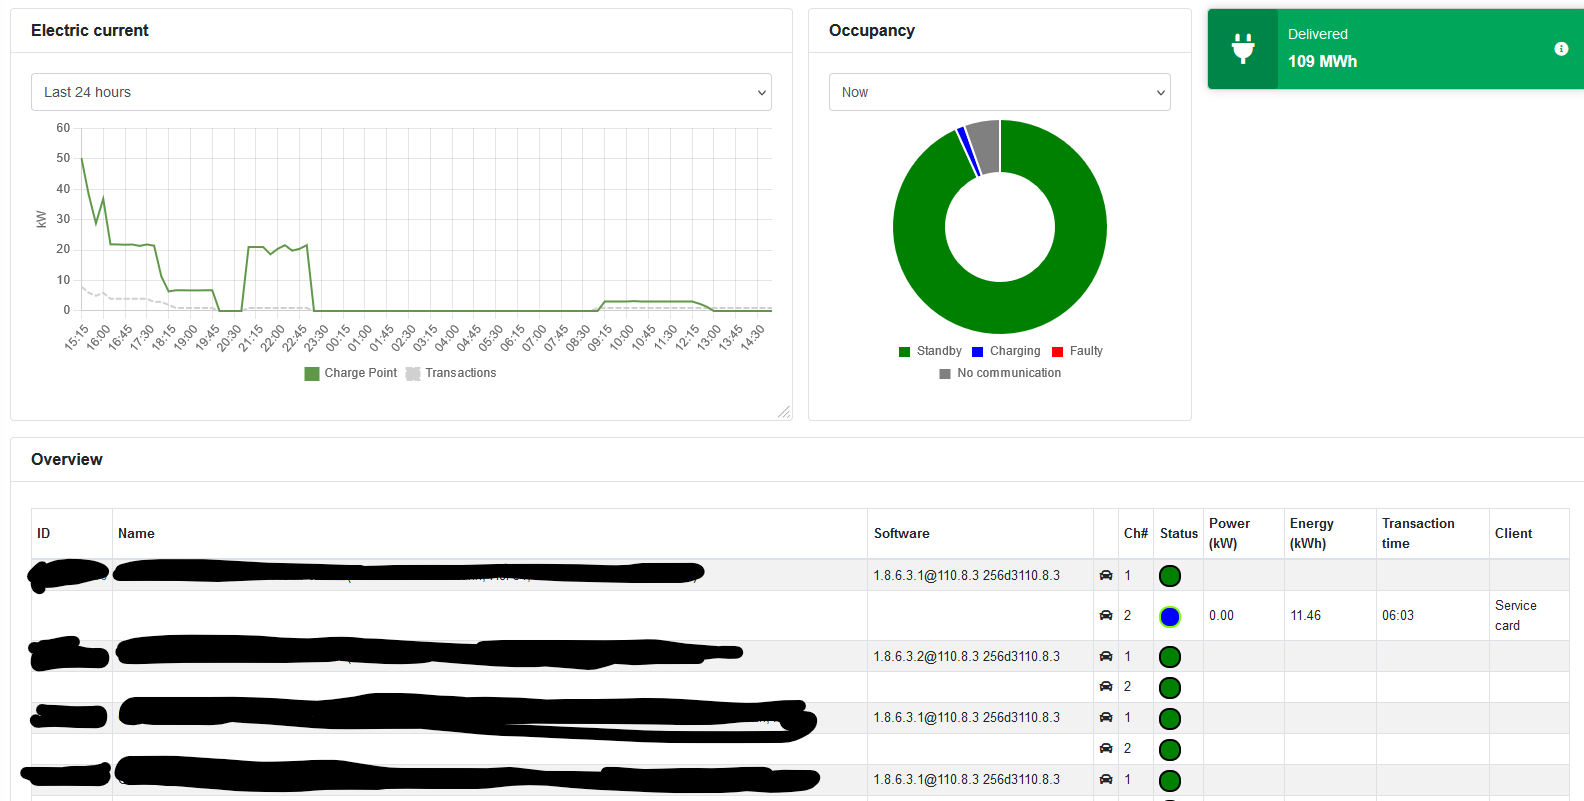
As a user I want to see load curve per selected chargepoints / charging units / sites
The load data of
a) A site
b) Multiple freely selected CUs (charging units)
c) Multiple freely selected CPs (charging points)
shall be added up to create
- Load curve (power) of all parallel sessions added up
- Amount of parallel charging sessions
these diagrams are created based on the submitted meter values.
With these diagrams it is easy to analyse:
- How often the power limit of a site is reached. Should I increase the grid connection to increase amount of kWh?
- Shall I add more charging points to the site because occupation is too high?
Activity Newest / Oldest
Ridvan Dumanoglu
Status changed to: Backlog
Ridvan Dumanoglu
Hey Robin, wir haben das Thema intern mit den entsprechenden Kollegen besprochen. Das ist eine sehr spezifische Anfrage, die sich Ad-Hoc so nicht umsetzen lässt. Wir würden dieses Thema aber gerne offen lassen, um zu schauen, ob in der Zukunft weitere User diese Anfrage unterstützen. Sobald dieses Thema an Gewicht gewinnt, würden wir es uns nochmal anschauen. Aus Grund der Kapazitäten und Ressourcen können wir leider nicht jede Idee/Vorstellung umsetzen und müssen bei der Planung und Ausführung Prioritäten setzen. Wir hoffen auf dein Verständnis und danken dir erneut für deinen Input! 🤝
Ridvan Dumanoglu
Hello Robin, this is an interesting point, I'll be discussing our options here with the team and will come back to you with updates as soon as I can. Thanks again! 💪
Ridvan Dumanoglu
Status changed to: Under review